
The S&P 500 (SPX) and Nasdaq Composite rose to a new all-time high after the US consumer inflation report came in lower than expected. This sparked a rally in Bitcoin (BTC), pushing the price above $66,000. The further Bitcoin moves from the $60,000 level, the less likely it is to collapse. However, this does not guarantee the beginning of a new uptrend.
Mike Novogratz, founder and CEO of Galaxy Digital, said during the company’s first-quarter earnings call that Bitcoin will likely consolidate between $55,000 and $75,000 before rising at the end of the current quarter.
The failure of the bears to sink Bitcoin below $60,000 appears to have attracted buyers. CoinShares’ “Weekly Digital Asset Fund Flows” report showed $130 million in flows into digital asset investment products last week, the first such event in five weeks.
The Wisconsin State Investment Board (SWIB) has disclosed investments in Bitcoin spot exchange-traded funds worth approximately $164 million. More such investments by institutions can be expected because they “tend to move in herds,” Eric Balchunas, a Bloomberg ETF analyst, said in an X post.
Can Bitcoin and select altcoins overcome near-term resistance and move higher? Let’s analyze the charts of the top 10 cryptocurrencies to find out.
Bitcoin price analysis
Bitcoin rose above its 20-day EMA ($62,765) on May 15, suggesting that the bulls have absorbed the supply.

If buyers maintain the momentum and push the price above the 50-day SMA ($65,152), it will open the doors to a potential rally to the massive resistance level at $73,777. The Bears may defend this level with all their might.
If the bears want to prevent an upward move, they will have to defend the 50-day SMA and pull the price to the $59,600 support level. The bulls will likely defend this level aggressively, because if the support breaks, BTC/USDT could fall to the 61.8% Fibonacci retracement level at $54,298.
Ethereum price analysis
Ethereum’s (ETH) strong rebound from the $2,850 support level on May 15 indicates that the bulls are aggressively defending this level.
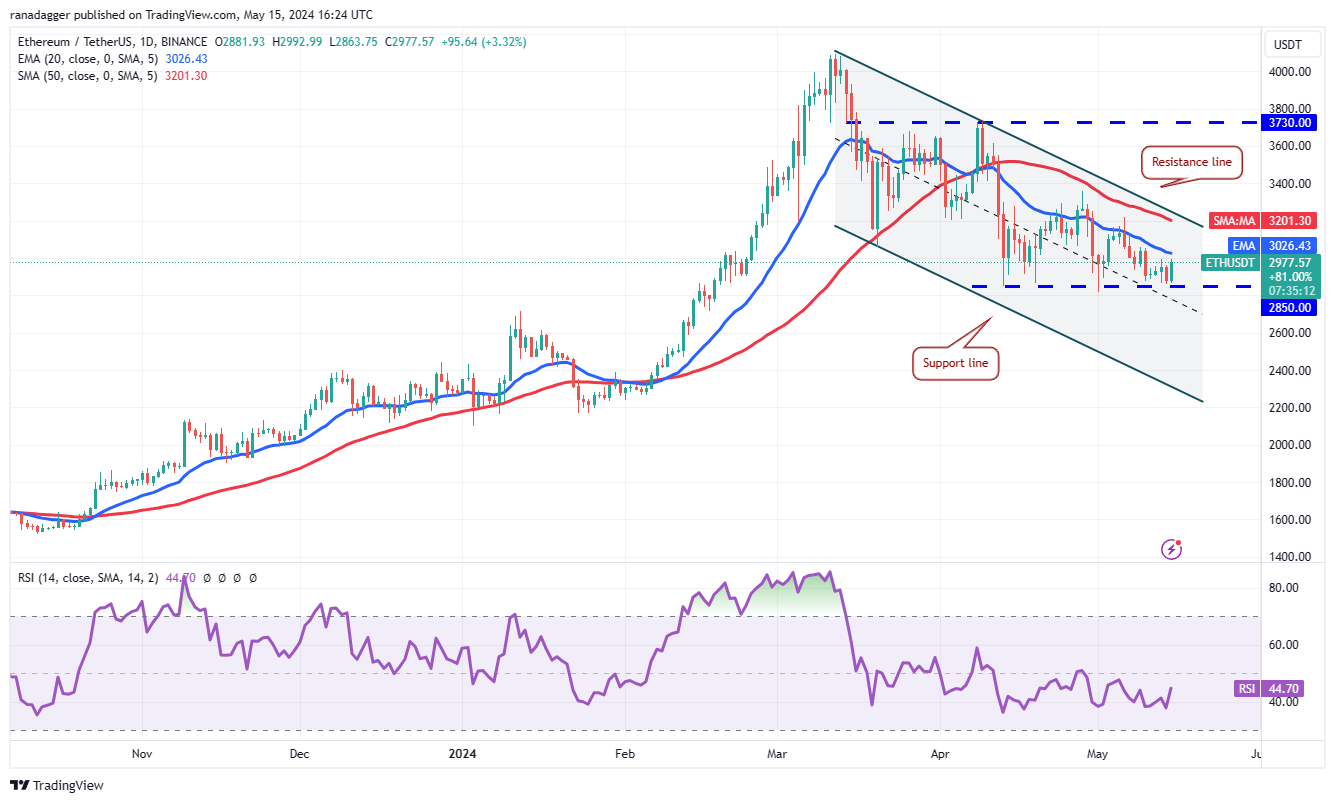
If buyers push the price above the 20-day EMA ($3,026), ETH/USDT could rise to the resistance line of the descending channel. The bears are likely to make a strong defense at the resistance line, but if the bulls prevail, the pair could start to rise to $3,400.
Conversely, if the price falls from the 20-day EMA, it will indicate that bears are selling on every slight rise. The pair could then retest the strong support at $2,850. A break below this support may initiate a downward movement towards the descending channel support line.
BNB price analysis
BNB (BNB) price fell below the moving averages on May 14, but rebounded sharply from the support line of the symmetrical triangle pattern. This indicates strong buying at lower levels.
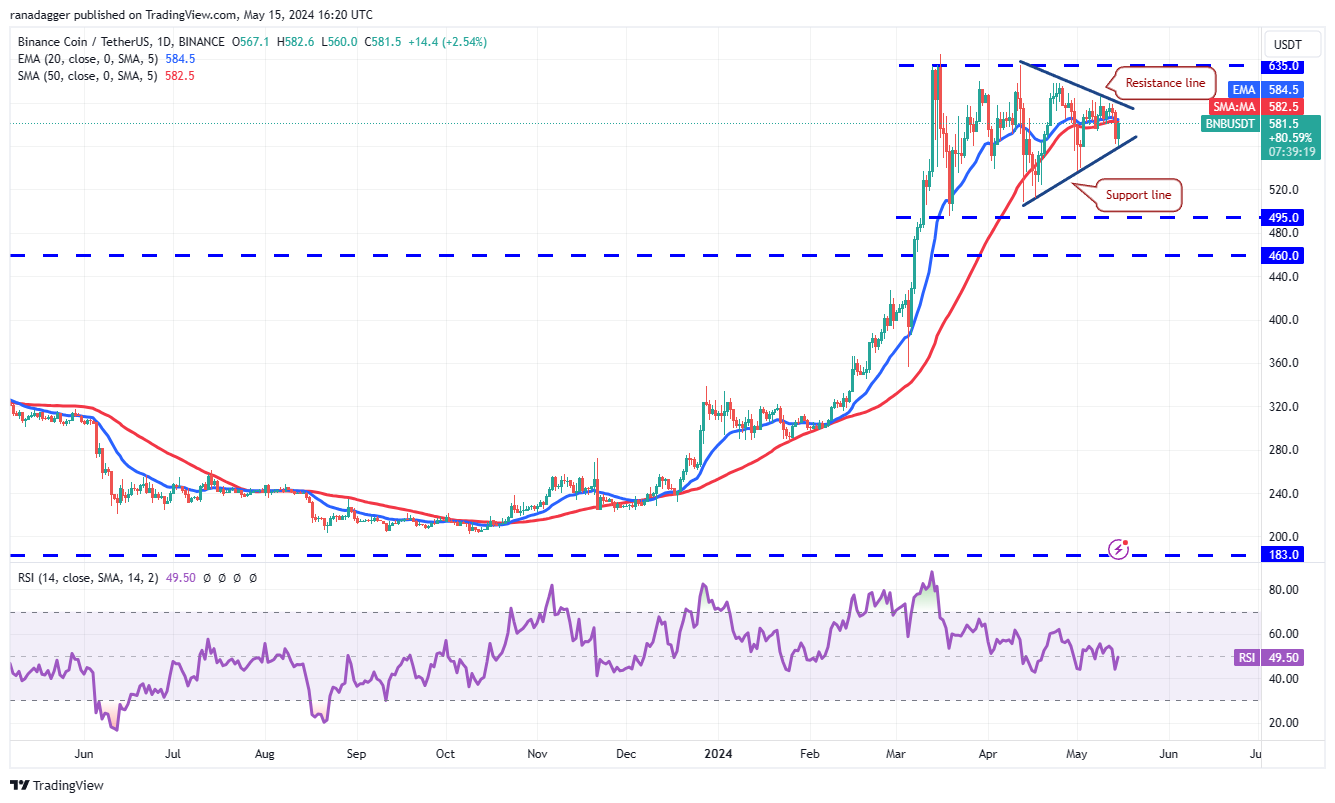
Buyers will try to take control by raising the price above the triangle resistance line. If that happens, BNB/USDT could rise to $634 and then to $692. The pattern target for the setup is $726.
Conversely, if the price declines and breaks below the triangle, it will indicate that the bears have gained control in the near term. The pair could fall towards the $495 level and then to the target pattern at $434.
Solana price analysis
Solana (SOL) broke above the 20-day EMA ($146) on May 15, indicating that selling pressure is declining.

If the price stays above $145, SOL/USDT could rise to $162. In a range, traders generally sell near resistance, and are likely to do so again near $162. If the price falls from the upper resistance level, it will indicate that the pair may remain within a range for a while.
A break above $162 or below $126 could initiate the next trend move. If the $162 level is crossed, the pair could rise to $205. On the other hand, a break below $126 could send the pair down to $100.
XRP price analysis
The bulls tried to push XRP (XRP) above the 20-day EMA ($0.51) on May 14, but the bears held their ground.

The bulls are once again trying to push the price above the 20-day EMA on May 15. If they can pull it back, the XRP/USDT pair could rise to the general resistance at $0.57. This level can be a difficult hurdle to overcome.
Alternatively, if the price falls from the 20-day EMA, the bears will try to consolidate their positions by pulling the price to the critical support level at $0.46. Buyers are expected to defend this level vigorously. A strong bounce from $0.46 will indicate that the range-bound move may continue for some time.
Toncoin price analysis
Buyers tried to push Toncoin (TON) above the $7.67 resistance on May 13, but the long wick in the candlestick shows selling at higher levels.

The slight advantage in favor of the bulls is that they haven’t ceded as much ground to the bears. This suggests that the bulls may make another move towards overhead resistance. If buyers push and maintain the price above $7.67, it will signal a resumption of the uptrend. TON/USDT pair could rise to $9.
This positive outlook will be invalidated in the near term if the price declines from the current level and falls below the moving averages.
Dogecoin price analysis
The bulls are trying to prevent Dogecoin (DOGE) from sliding below the neckline and completing a bearish head and shoulders pattern.
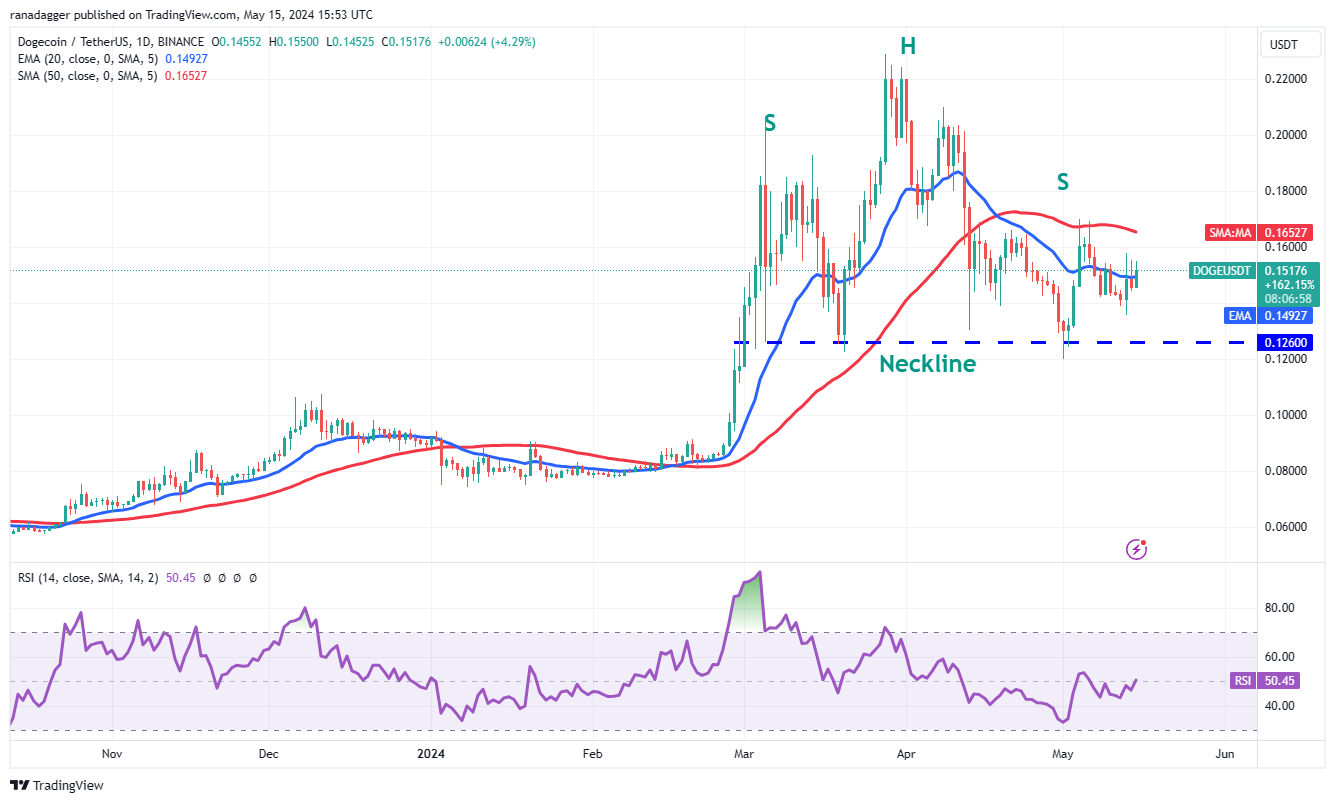
The flat 20-day EMA ($0.15) and the RSI near the midpoint indicate a range-bound move in the near term. If the price rises above the 20-day SMA, DOGE/USDT could reach the 50-day SMA ($0.17). This is a key level that the bears must defend as a break above it could pave the way for a rise to $0.21.
The bears will take control if they go down and keep the price below the neckline of the H&S pattern. This could start to fall to $0.08.
Related: Why did the price of Bitcoin rise today?
Cardano price analysis
The failure of the bears to keep Cardano (ADA) below the support line on May 15 attracted aggressive buying by the bulls.

The 20-day EMA and the RSI in negative territory indicate that the bears have the upper hand. If the price falls from the 20-day EMA and continues below the support line, it will signal the beginning of the next phase of the downtrend. ADA/USDT could fall to $0.35.
Alternatively, if the price continues to rise and jumps above the 20-day EMA, it will indicate that the bears are losing their grip. The pair may rise to the 50-day simple moving average ($0.51) and later to $0.57.
Avalanche price analysis
Avalanche (AVAX) has been trading below the 20-day EMA ($35) over the past few days, but bears failed to pull the price back to the range support at $29. This indicates that selling is drying up at lower levels.
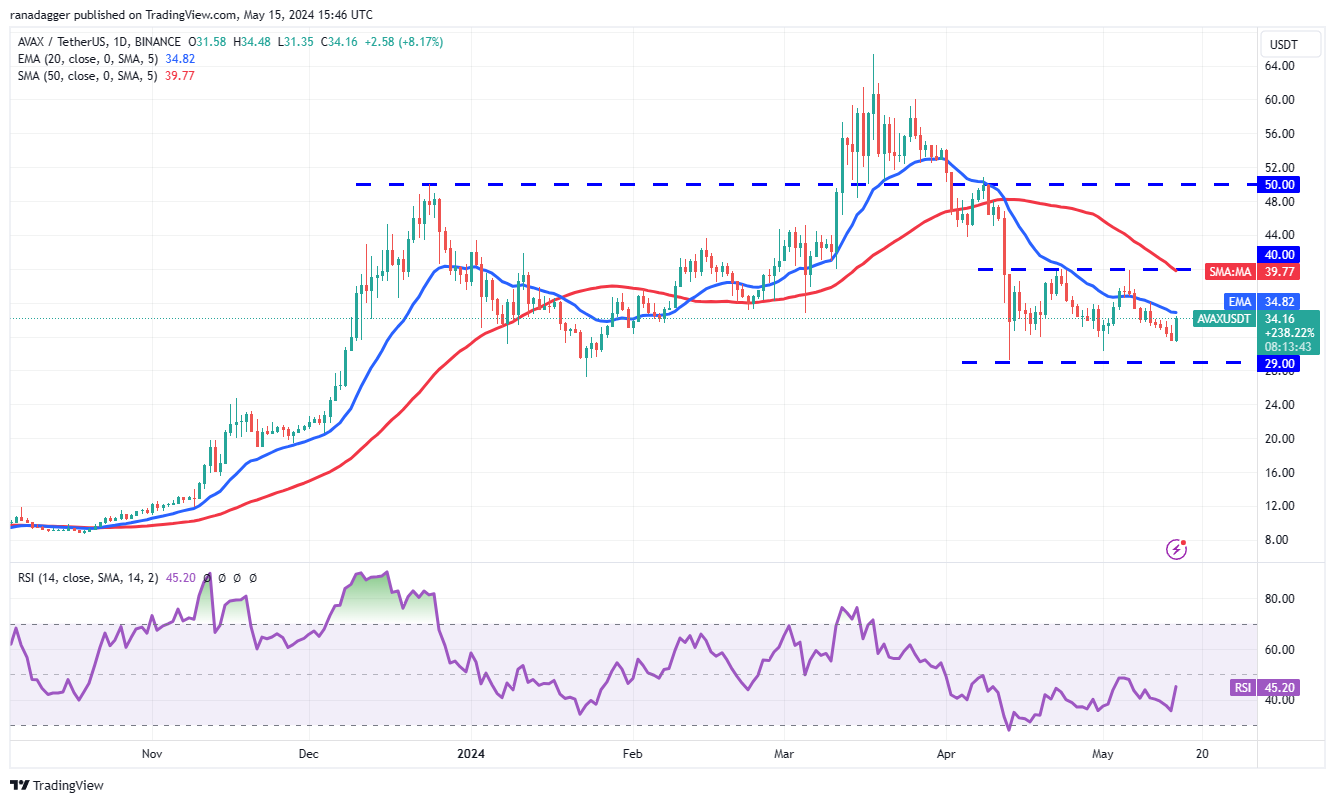
The bulls will try to push the price above the 20-day EMA. If they succeed, it would indicate that the AVAX/USDT pair could remain within the $40-$29 range for a few more days. A break above $40 could start a rally to $50.
Contrary to this assumption, if the price falls from the 20-day EMA, it will indicate that the bears are trying to take control. The pair may then fall to the strong support level at $29. If this level breaks, it will signal the beginning of the next phase of the downtrend. The pair may then fall to the next support level at $25.
Shiba Inu price analysis
The bulls successfully protected the support line of the Shiba Inu (SHIB) symmetrical triangle pattern on May 13.

The 20-day EMA ($0.000023) and the RSI near the midpoint do not give a clear advantage to either the bulls or the bears. It is difficult to predict with certainty the direction of the breakout, therefore it is better to wait until the price rises above or falls below the triangle before placing large bets.
If the price breaks above the triangle, it will indicate that the corrective phase may be over. The SHIB/USDT pair could rise to $0.000030 and then to $0.000033. Conversely, a break below the triangle could open the door to a decline to the 78.6% Fibonacci retracement level at $0.000017.
This article does not contain investment advice or recommendations. Every investment and trading move involves risks, and readers should conduct their own research when making a decision.